
| Click
on images to see larger maps: |
Colours and resolution may differ from the original maps. | |
|
|
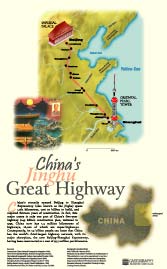
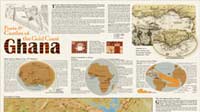
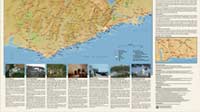
This map shows the history and geography of the various slave forts and castles on the coast of Ghana, in West Africa. The intended audience is tourists in Ghana. The map was created using a wide variety of mapping and graphic design applications. Of particular note is the shaded relief effect, which was derived from Digital Elevation Models and edited for cartographic effect in Photoshop. The map is presented in two parts. The final map is 24 x 20 inches.
|
|
 Full Map: 111 KB |
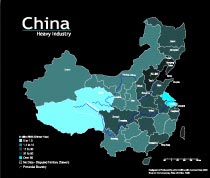
The hill-shading on the basemap was generated in Adobe Photoshop 6, as was the photo-collage and locator map. The buildings are isometric projections, and were created in Adobe Illustrator 9. The final map was created in Illustrator. Click to see the Oriental Pearl Tower: 34 KB |
|
  Map Segments: 250 KB (each) |
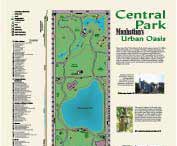
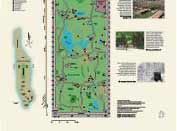
This is a map of New York City’s Central Park, showing the wide variety of facilities and services available. This map emphasizes such concepts as colour choice, symbolization, and text placement. The map was digitized, designed and produced using Adobe Illustrator 9. It is presented in two parts. The final map is 22 x 15 inches. |
|
 Full Map: 134 KB |
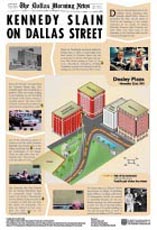
The buildings and plaza are isometric projections, and were created in Adobe Illustrator 9. The photographs were edited in Adobe Photoshop 6. The final map was composed in Illustrator.
|
|
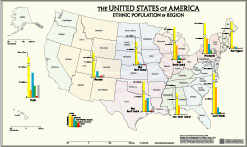 Full Map: 83 KB |
The
map was projected and scaled using Avenza's MAPublisher 4. Final
design work was done in Adobe Photoshop 6 and Illustrator 9. |
|
 Full Map: 98 KB |
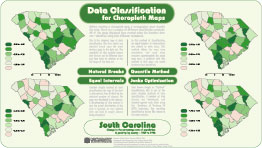
While
this map displays the change in the rate of poverty in South Carolina,
its real purpose is to show how data classification methods
can alter a thematic map’s
appearance. The same data set was classified using four different
statistical techniques. The maps were projected and scaled using Avenza’s MAPublisher 4, and the final map was composed in Illustrator 9. |
|
 Full Map: 93 KB |
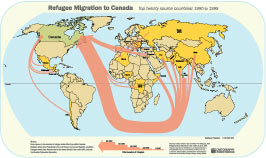
Flow-line mapping shows the origin, destination and volume of people, goods or services. This map shows the flow of refugees to Canada over the last ten years. This map was projected and scaled with Avenza’s MAPublisher 4. The final map was created in Illustrator 9.
|
|
 Full map: 48 KB |
This simple topographic map of Kirkland Lake was created using a variety GIS file formats. A number of .DXF, .DLG and .E00 files were projected and combined to make the final map. The source files were manipulated using ESRI Arc/INFO Workstation 8.1, Arc Toolbox 8.1 and ArcView 3.2.
|
|
|
|
This map displays an orthorectified aeiral photo of the Balsam Lake Provincial Park, with rectified GPS data. The final map was treated with a retro-fifties look. The photo was rectified and GPS points and vectors were overlayed in Microstation. The final map was composed in Adobe Illustrator.
|
|
 Full Map: 22 KB |
The map was manually digitized and the linework cleaned. A topology was built, and thematic data was attached. The final maps were then generated automatically. |
|
 Full Map: 58 KB |
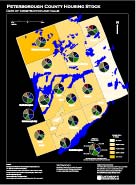
This is a thematic map of the housing stock in Peterborough County, Ontario. The map was generated using Bentley Systems Microstation 7.1. The UTM basemap is geo-referenced, and the thematic data was then added using a Microstation Basic macro.
|
|
 |
The graphics
were designed in Adobe Photoshop and the webpages were laid out
in Claris Homepage. |
|
 |
The thesis chapters were created with Adobe Acrobat PDF Writer. The thesis is housed on the (now closed) University of Manitoba’s Disaster Research Institute website, which I also designed. |
|
| ^top |

![]()
![]()
![]()
![]()
![]()
![]()
![]()
![]()